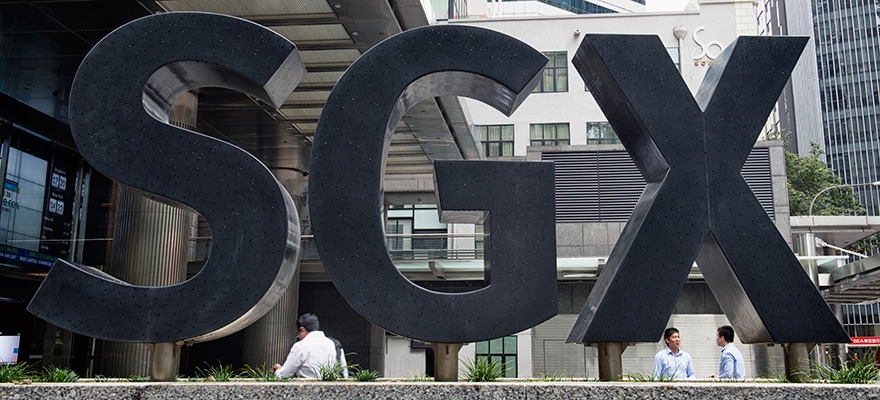
The Singapore Exchange (SGX) has reported its Q2 FY2016 operating metrics, which were characterized by a slightly waning profit relative to last year, according to an SGX statement.
The exchange yielded a net profit of $83.7 million in Q2 FY2016, relative to $86.6 million over the same period last year or -3.3% YoY from Q2 FY2015. By extension, revenues at SGX faced a similar trajectory, maintaining a tight consolidation, albeit slightly lower than last year’s figures, showing $194.6 million in Q2 FY2016 vs. $195.1 million in Q2 FY2015, or less than -1.0% YoY.
In addition, SGX’s expenses have also notched a steady increase as of Q2 FY2016, rising 4.0% YoY to $97.1 million from $93.5 million in Q2 FY2015. Its earnings per share also took a slight dive to 7.8 cents in Q2 FY2016 from 8.1 cents last year, constituting a -3.7% decline YoY – this was partially offset by the Board of Directors, which declared an interim dividend of 5 cents per share, payable on 4 February 2016.
H1 Snapshot More Upbeat
The figure was slightly more optimistic during H1 FY2016, with SGX’s net profit swelling double digits to $183.0 million, up 11% YoY from $164.2 million in Q2 FY2015.
According to Loh Boon Chye, Chief Executive Officer (CEO) of SGX in a recent statement on the metrics: “It was a challenging quarter with persistent weak market sentiment. While net profit this quarter was $84 million, down 3% from a year earlier, our net profit for first half of FY2016 improved by 11% to $183 million, on the back of a strong first quarter.“
Results Breakdown
In terms of derivatives revenues at SGX, the figure grew by a factor of $1.1 million or 1.0% YoY to $77.6 million in Q2 FY2016 – overall derivatives trading counted towards 40.0% of all revenues at SGX in Q2 FY2016, up from just 39.0% a year ago. Moreover, equity and commodities derivatives revenue was reported at $56.3 million in Q2 FY2016, down -3.0% from $58.0 million in Q1 FY2016.
The results follow on a that showed more robust figures, which by and large explains the strength of the group’s H1 performance.


Be First to Comment