The Australian versus the US dollar currency pair seems to be determined to push higher. Is this a bullish sign, or its the bears preparing a good spot from where to start a new downwards leg?
Long-term perspective
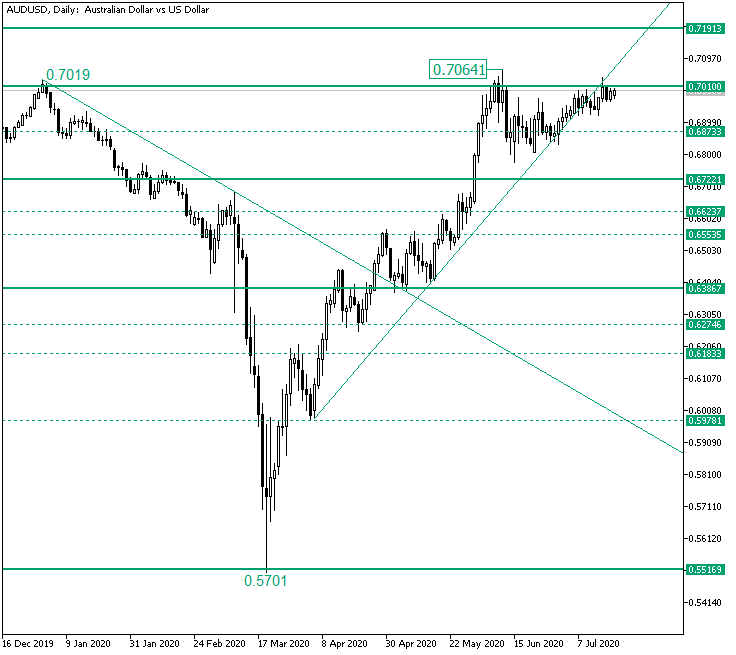
The rally that started from the 0.5701 low extended to as high as 0.7064. From there, given the fact that the bears were delighted to see the previous high of 0.7019 revisited, it retraced under the intermediary level of 0.6873.
But since every descend was short-lived, as for every bearish downwards leg, there was a quick response from the bullish side. So, after three bearish failed attempts do drive the price lower, the bulls used the ascending trendline as a guide to climb on it.
This led the price back to the 0.7010 level. Of course, the bears kept defending the level, but after the invalidated bearish engulfing on July 16, the bulls can be considered as the ones leading the situation.
So, the first scenario that is to be expected is the one in which the price validates the 0.7010 level as support. The first clue of this would be a candle closing above the level and, preferably, above the high of the candle on July 15.
Another possibility is for the price to extend above the 0.7010 level and then to make a throwback. For either of the two, the main target for the bulls is represented by 0.7191.
But even if the price does not pierce 0.7010, the intermediary level of 0.6873 is a good fit for a new bullish rally. Only if 0.6873 cedes, then the bears can extend their movement until the 0.6722 important support level.
Short-term perspective
From the 0.6776 low, the price is in an ascending trend, one which from the 0.6832 low accelerated towards the firm resistance of 0.7002, etching the high of 0.7037.
As long as the price oscillates above the steeper trendline (the inner one), the bulls’ window of opportunity to pierce 0.7002 is open. Once that happens and 0.7002 is confirmed as support, they can continue their march towards the next resistance, 0.7081.
Still, if the inner line gets pierced, then the double support defined by the outer trendline and the 0.6949 intermediary level can aid a new bullish movement.
Only if the potential double support gets pierced, then the bears could take hold of the situation and send the price to 0.6889 and, later on, 0.6816.
Levels to keep an eye on:
D1: 0.7010 0.7191 0.6873 0.6722

H4: 0.7002 0.7081 0.6949 0.6889 0.6816
If you have any questions, comments, or opinions regarding the US Dollar, feel free to post them using the commentary form below.


Be First to Comment