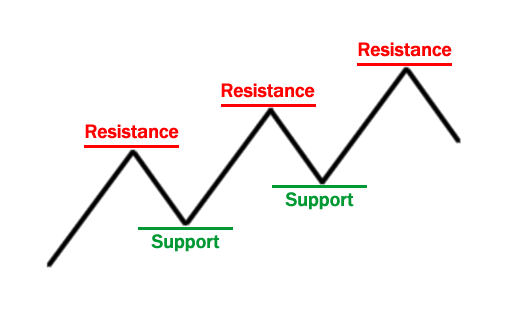
The support/resistance trading strategy is used for both short and long-term binary trading. With it you take into account historical levels that a certain currency, stock, commodity or index has reached and reversed from.
To be able to understand this strategy, one has to know the definitions of support and resistance. The first is defined as a historical level that a certain price has previously been unable to fall below, or a position that a lot of buyers enter. For resistance levels it’s the opposite – a level that the price reaches, but regularly falls down from, as more traders start selling it.
In order to take advantage of how this style works, there needs to be some knowledge of charts and how to read them. This starts with selecting the most suitable chart type such as Japanese candlesticks, bar, line etc. After this comes the establishiment of previous patterns and occurrences of the price reaching a certain level and then backing off it. These need to be found over a long enough period (for turbo trades this can be looking at 30 minutes or a full hour back and further increases with the longevity of the binary option that is being traded).
There is no preset number of these occurrences that can fully guarantee profitability (just like there is no single trading strategy that guarantees success), this would have to be determined by traders themselves.
After identifying the levels the next most important thing is entering the trades at the correct moment. This would be when the price reaches the respective support or resistance and is believed to be on the verge of reversing, or has already begun doing so.
Binary options traders have adapted the strategy to turbo options that last several minutes or seconds. They have been popular in slower markets, where timing has an even greater importance as the window of opportunity can last several seconds. This would be between the close of the US stock markets and the open of the Australian one. During this time, binary option brokers still offer currency trading for the most popular pairs, albeit not on the shortest types of options.
Hourly and daily trades are also possible using this strategy. This would almost always fall within the most active hours, as the largest number of testing support and resistance levels happens then. Other factors such as news, announcements and economic data come into play here and traders use them to confirm stronger levels on which they can trade.
In the above example you can see a recent four-hour chart of USD/CHF with two buying signals and three selling ones, indicating the currency pair was moving in a range for this period – the most suitable ground for support/resistance trading.
The strategy as a whole has to be based on previous research that provides some assurance that the levels will not only hold the current price direction, but also make it reverse. There are no general guarantees that this will happen, as each new situation comes with a multitude of other factors. Regardless, some traders have come to appreciate the relative simplicity the strategy offers when it comes to deciding the timing and direction of their trades.


Be First to Comment