GBP/USD – Sterling/dollar bears showing no signs of giving up control
The GBP/USD continues to be very weak and the overall downtrend is still intact, as we can see in the daily chart below. Price broke lower last week after an inside bar sell signal pattern formed on Tuesday, and prices have been subdued since. Traders not already in short positions can continue to look for price action sell signals on any near-term strength this week whilst under 1.3533 key resistance to rejoin the downtrend from value / resistance.
NZD/USD – Kiwi/dollar falling lower after pin bar signal
The NZD/USD has been in a trading range, oscillating between resistance up near 0.7300 and support down near 0.6960 since about the beginning of June. You will notice that price formed a large exhaustion / pin bar reversal signal last Thursday that showed a strong rejection of key resistance near 0.7290 / 0.7300. Notice that prices weakened on Friday after retracing to near the halfway point of the pin bar and we see potential for a 100 – 200 pip sell-off this week, perhaps to re-test key support near 0.6960 area.
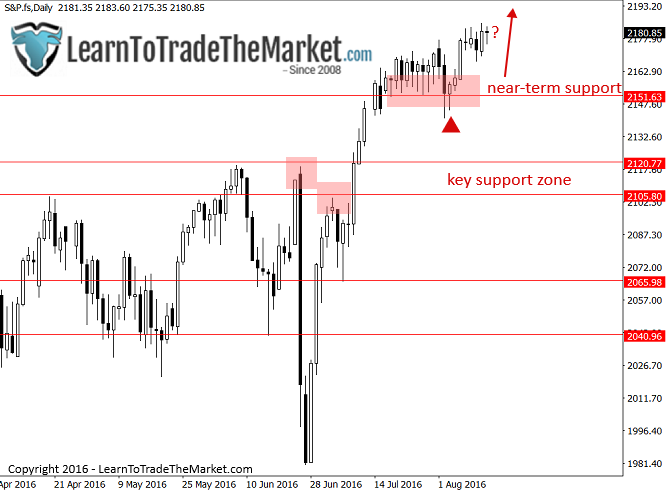
S&P500 – S&P500 continues trending higher
The S&P500 remains in a strong long-term uptrend and we can see prices were buoyant last week, staying up near the recent highs. Our strategy of choice in this market is to look to buy from support on a pullback and we can watch 2150.00 near-term support for price action buy signals this week if we get any weakness. The idea here is to look for some temporary weakness, followed by a strong price action reversal signal from a horizontal support level, to rejoin this up-trending market from a high-probability position.

This article was written by Nial Fuller. Nial is a highly regarded professional trader and author. He is the founder of Learn To Trade The Market, the worlds foremost trading education resource. To learn more, visit


Be First to Comment