Sergey Shirko has been studying the forex market for about ten years, and has been working in the FX industry since 2009. He has worked at a number of companies, including TeleTrade and Soft-FX. He has been the Chief Dealer of FXOpen since December 2012.
Inspired by your comments, I have decided to continue my series of articles on the subject of trading. This time I want to share with you my current observations through the prism of my methods of analysis, which I have already mentioned before. Today I want to show you the conflicting signals that the market can show, how important it is in these circumstances to understand the tools that you use and what to do if your trading system has stopped working.
Lately most of my attention has been drawn to two markets: gold and the British pound.
The reason, first of all, is in the fact that these two instruments have met the conditions according to the COT report which I mentioned in . In addition, the operators here have the opposite expectations of the market movement than the public – that the pound will fall as a result of Brexit, and that gold will rise for the same reasons, due to uncertainty.

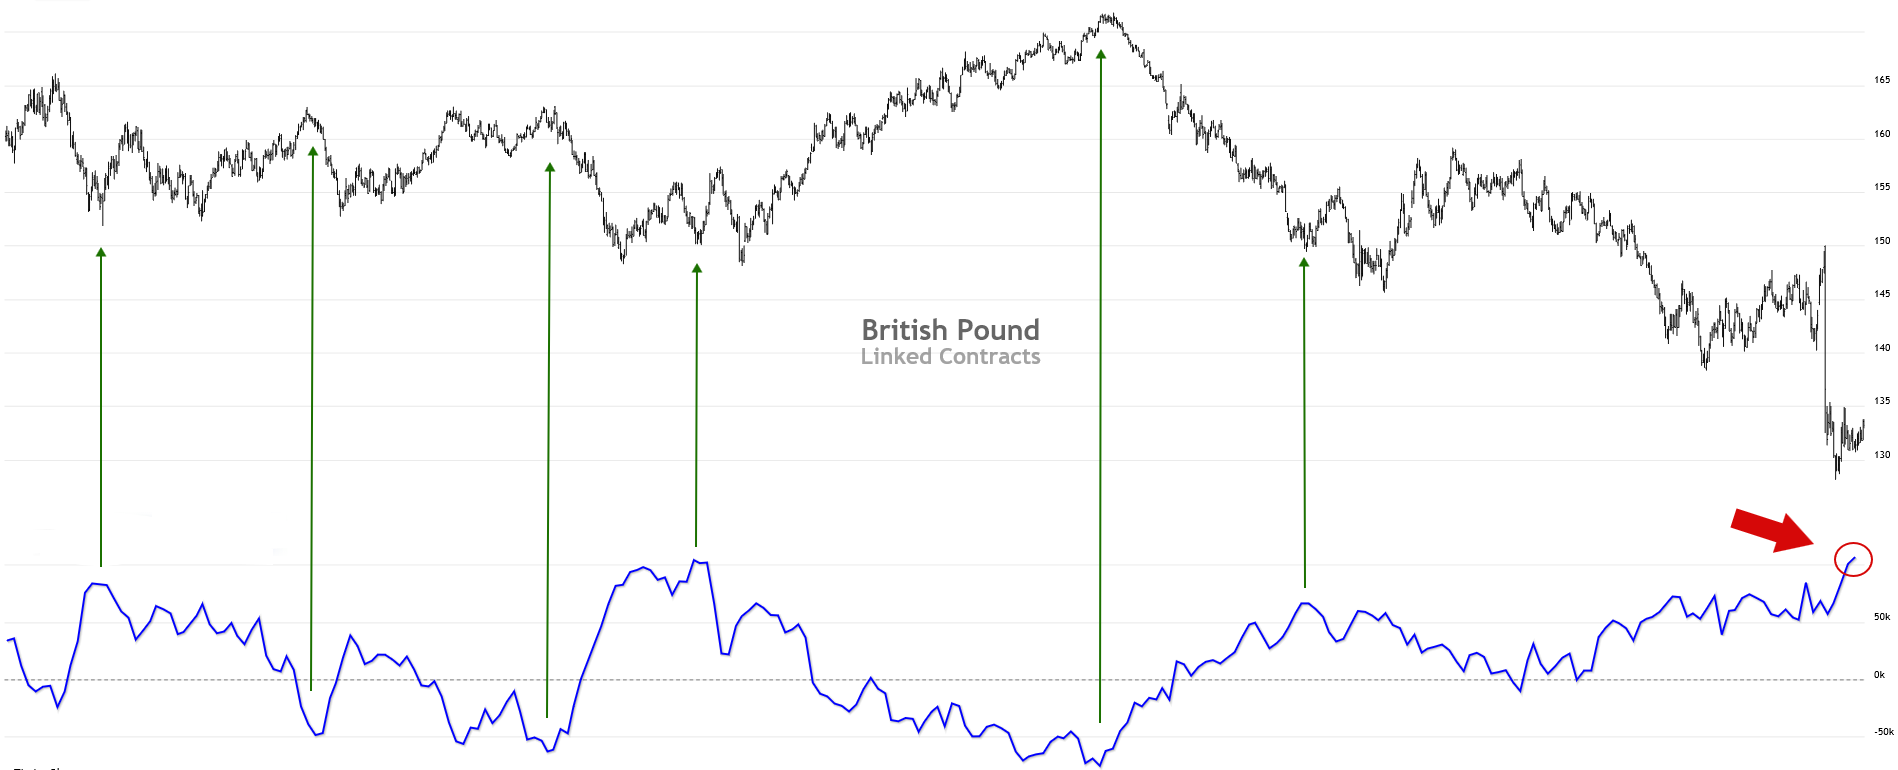
The screenshot is a daily chart, with British pound futures at the top and the net position of operators at the bottom. Here I have noted for you the maximum values of the net position of operators, that was accompanied by a reversal of the market.
We can see that at the moment operators have the highest long position and since June 27 this continues to grow. After the announcement of the results of the referendum, which took place on 23 June, all this time we hear from the media that the UK’s exit from the EU may have a negative impact on the economy and the national currency. All this time the most competent and influential group of market participants have been buying and have increased their long positions.
Don’t you find it strange?
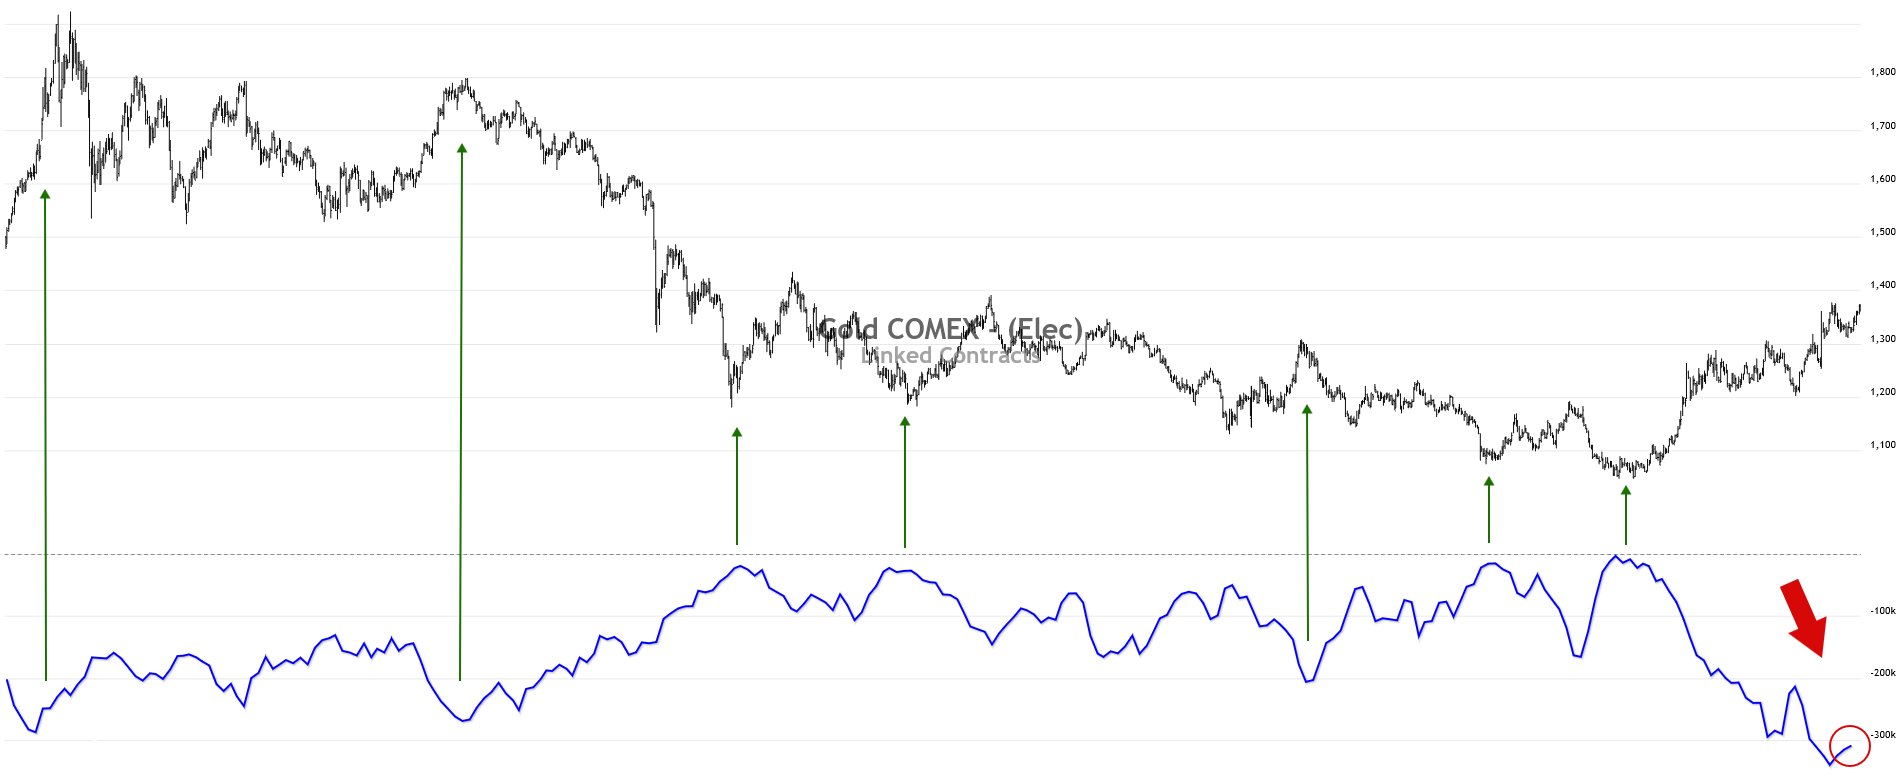
This screenshot shows a daily chart of the gold and the net position of operators, where I also have noted the maximum value, which was accompanied by a reversal of the market. In general this is the same pattern as with the British pound, only this time the operators have a maximum net short.
What does it all mean?
I would like to note straightaway that all you are about to read is not conventional wisdom but my personal interpretation, and I, being just a human being, can make mistakes.
In my opinion, in order to solve this puzzle it is important to understand the goals the operator may have while opening a position in one direction or the other, but first I would like to draw your attention to something else.
As I have mentioned before, in the COT report three groups of traders are represented: operators (commercial), large speculators (non-commercial), and small speculators (nonreportable positions), and the whole open market volume – open interest – is distributed among these three groups.

In our example the open volume is 231 644 contracts. This means if you sum up all the longs of our three groups (215 500 + 16 144) we get 231 644 contracts and vice versa, if you sum up all the shorts (189 330 + 42 314) we get the same result.
As we know, each deal has two sides — the seller and the buyer. Therefore, as soon as one of the participants, no matter which group he belongs to, decides to buy, someone else sells to him immediately.
Question No. 1.
Is it always correct to say that the one who satisfies the desire of the other side to open the trade, is acting of their own free will? My answer is no.
This means that if I, a small speculator inspired by the desire to make money on the fall of the British pound, opened a short position, then the one who bought it probably did not act on their own, but out of necessity. And if so, in this case the buyer did not have a speculative purpose, but rather commercial, as he was forced to take the opposite side of the market i.e., acted as a market maker.
Question No. 2.
To which of the three groups does this participant belong, in your opinion? Of course, the operators.
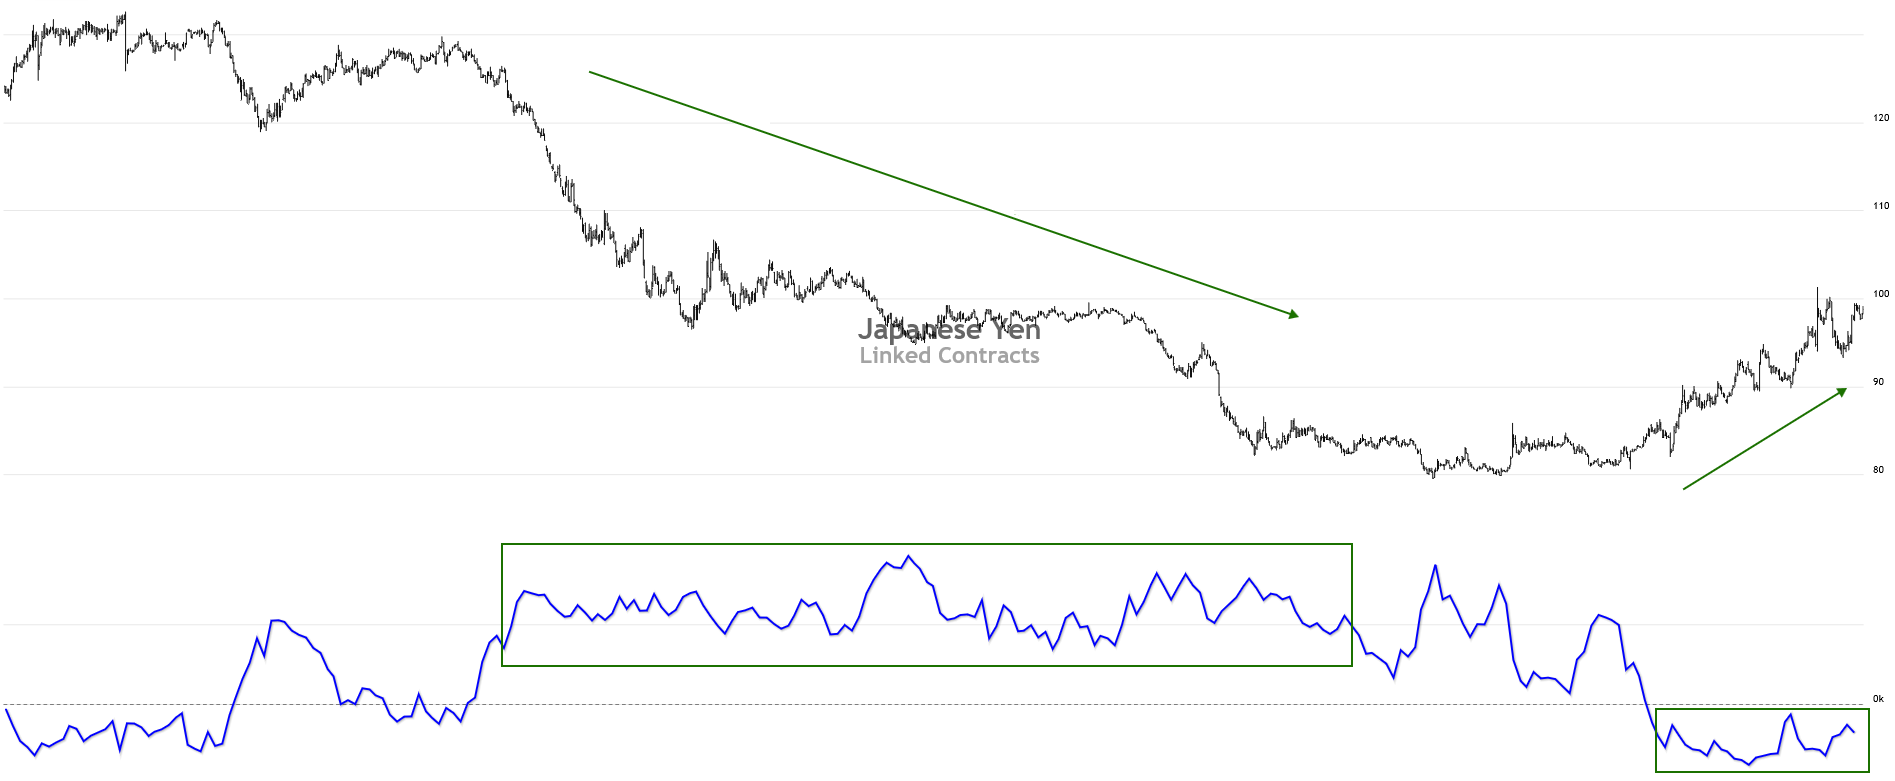
Thus, when some certain mood is dominated on the market and the majority of participants make one-way trades i.e. on the same side of the market, the minority, in the face of the operators, is forced to accept the risk and take the opposite side of the market. This is why in the media we hear one position, but the COT report shows the opposite outcome. The Japanese yen future is a good example of this.

When the market has a clear trend, the operators have no other choice but to take the opposite side of the market and keep the position against that trend. They have unlimited resources at their disposal, so are able to hold this position for a very long time, if it is required.
Of course, this is not the only function of the operators and, perhaps, not the most important one. Among others I would distinguish hedging, but I’d rather discuss it next time.
Here I would like to draw your attention to the importance of a good understanding of the tools you use, the ability to interpret the signals they give you and what market is the best for each one, in order for you to stay positive and not to tell yourself one day that nothing works here and it is impossible to predict the markets.
Conclusion
The conclusion I made for myself is that in order to understand the market conditions we should not be guided by just one single tool. There should be at least two of them, and preferably three or more. If we took our example and added to it a tool that determined the trend, this combination would help us to avoid most of the false signals.


Be First to Comment