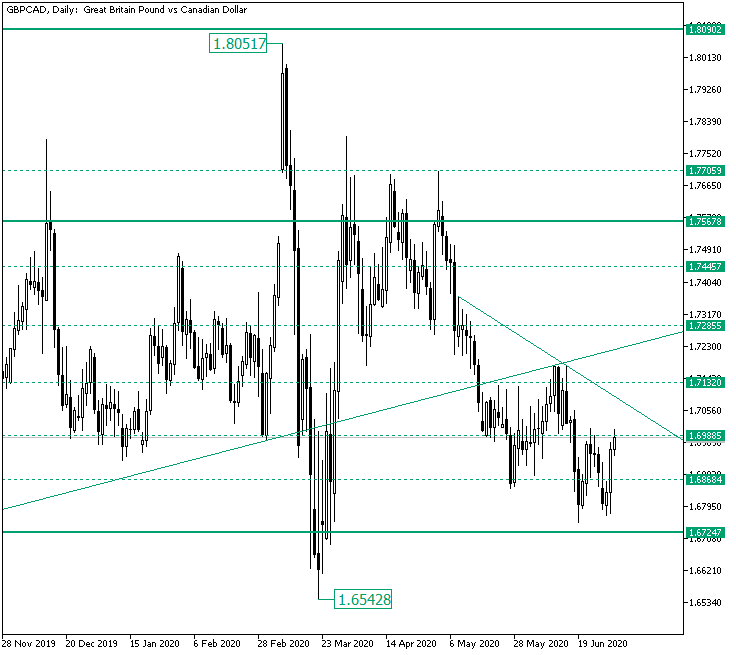
The Great Britain pound versus the Canadian dollar currency pair seems not to be willing to go beneath 1.6724. Can the bulls put the double bottom formation to their use?
Long-term perspective
The depreciation that started after the third unsuccessful bullish attempt to go beyond the firm 1.7567 resistance level back in May extended a hair away from the solid support of 1.6724.
To be more exact, the 1.6800 psychological level — not highlighted on the chart — is responsible for helping the bulls to regroup. And, considering the outcome, it can be said that the bulls made use of the chance they were given to, defining on the chart the potential double bottom formation that has its neckline at the 1.6988 intermediary level.
Of course, the chart pattern comes in a context that makes the bears question their willingness to try further depreciation, being backed by two main arguments. The first one is that the trend is a descending one — note the lower highs and lows. Secondly, the potential double bottom lies above strong support, as mentioned earlier. And, as a double bottom usually forms around a support area and after a descending trend, signaling the potential ending of that trend, the bulls can consider that the market is in their favor.
But, for their plans to match the reality, they have to take further steps. The first one is to pierce 1.6988 and validate it as a supportive neckline. The second one is to pass the descending trendline. Even if a retracement from the trendline may look like it was confirmed, the truth could be that the market is throwing back to validate the neckline, which in turn could service an appreciation that pierces the 1.7132 intermediary level and certifies it as support. If this happens, the bulls can then extend their gains until 1.7285, an intermediary level as well.
On the flip side, if the 1.6988 level stands as resistance, then sideways trading can be seen, supported by 1.6724.
Short-term perspective
The rally from the 1.6769 low pierced both the 1.6842 intermediary and 1.6965 solid resistance levels. As long as the price oscillates above the latter, the bulls can eye the next resistance level, represented by 1.7094, which, if conquered, opens the door to 1.7244.
However, if the bears take over and send the price under 1.6965, then they can post the price to 1.6842 and, later on, to 1.6698.
Levels to keep an eye on:
D1: 1.6988 1.7132 1.7285 1.6724

H4: 1.6965 1.7094 1.7244 1.6842 1.6698
If you have any questions, comments, or opinions regarding the Technical Analysis, feel free to post them using the commentary form below.


Be First to Comment